Survey of macroeconomic forecasts - April 2012
Survey of macroeconomic forecasts
The macroeconomic scenario of the Convergence Programme, macroeconomic frameworks of the State Budget and the Budgetary Outlook and MoF forecasts are regularly compared with the results of macroeconomic indicators survey among important relevant institutions (the so-called Colloquium). The results of the 33rd Colloquium, which took place in April 2012, are based on the forecasts of 15 institutions (MoF, MPO, MPSV, CNB, Ceska sporitelna, CSOB, Komercni banka, Liberalni institut, Economics Institute of the Academy of Sciences of the Czech Republic, Patria Finance, Generali PPF Asset Management, Raiffeisenbank, The Union of Czech Production Co-operatives, Confederation of Industry of the Czech Republic, UniCredit Bank). To make the survey more representative, the forecasts of the EC (February 2012 Interim Forecast) and the IMF (April 2012 World Economic Outlook) have been added.
The aim of the Colloquium was to get an idea of the views regarding the expected development of our economy and to assess the key tendencies within the horizon of years 2012-2015, with the years 2014 and 2015 seen as an indicative outlook. Key indicators and the last MoF forecast are summed up in Tables 1 and 2.
The basic trends of development in 2012 and 2013, envisaged in the current MoF Macroeconomic Forecast, are fully consistent with the forecasts of other institutions. The comparison for the years 2014 and 2015 is complicated by the fact that this period is not covered by the forecasts of all institutions (the whole period 2012-2015 is covered, at least for some indicators, by forecasts of 8 institutions). For these years, therefore, the average of forecasts is significantly biased by just two forecasts that, maybe out of fears from unresolved crisis in the eurozone, foresee a stagnation of the Czech economy as the most likely scenario.
| 2012 | 2013 | ||||||||
|---|---|---|---|---|---|---|---|---|---|
| min. | average | max. | MoF CR | min. | average | max. | MoF CR | ||
| Assumptions | |||||||||
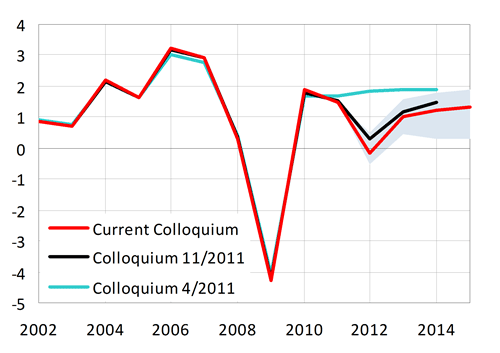
| GDP of EA12 | real growth in % | -0,5 | -0,2 | 0,5 | -0,3 | 0,5 | 1,0 | 1,6 | 0,7 |
| Crude oil Brent | USD/barrel | 110 | 116 | 123 | 115 | 107 | 117 | 130 | 113 |
| 3M PRIBOR | average in % | 1,0 | 1,2 | 1,6 | 1,2 | 0,9 | 1,4 | 2,3 | 1,2 |
| YTM of 10Y gov. bonds | average in % | 3,2 | 3,4 | 3,6 | 3,4 | 3,2 | 3,6 | 3,9 | 3,5 |
| CZK/EUR exchange rate | 24,4 | 24,8 | 25,0 | 25,0 | 22,9 | 24,1 | 25,2 | 24,9 | |
| USD/EUR exchange rate | 1,28 | 1,31 | 1,35 | 1,30 | 1,25 | 1,30 | 1,39 | 1,30 | |
| Main indicators | |||||||||
| Gross domestic product | real growth in % | -0,5 | 0,1 | 0,5 | 0,2 | 0,0 | 1,6 | 2,5 | 1,3 |
| Contr. of change in inventories | percentage points | -1,6 | -0,2 | 0,4 | 0,3 | -0,5 | 0,1 | 0,6 | 0,0 |
| Contr. of foreign balance | percentage points | -0,5 | 0,9 | 2,2 | 1,0 | 0,4 | 1,1 | 3,0 | 0,8 |
| Consumption of households | real growth in % | -1,3 | -0,6 | 0,3 | -0,4 | -0,9 | 0,6 | 1,5 | 0,2 |
| Consumption of government | real growth in % | -3,7 | -1,7 | 0,3 | -3,7 | -1,5 | -0,4 | 1,0 | -0,5 |
| Fixed capital formation | real growth in % | -1,8 | -0,3 | 2,1 | -0,5 | -1,9 | 1,3 | 3,6 | 2,1 |
| GDP deflator | growth in % | 0,5 | 1,6 | 2,3 | 2,0 | 0,8 | 1,6 | 2,7 | 1,4 |
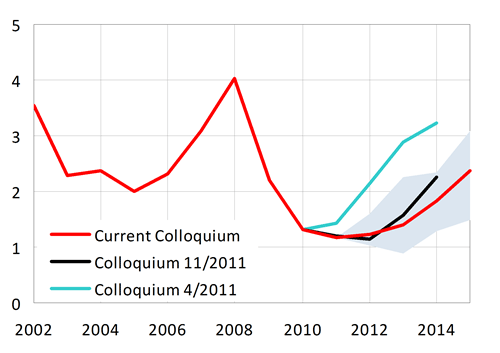
| Inflation rate (aop) | in % | 2,4 | 3,3 | 3,6 | 3,3 | 1,5 | 2,2 | 3,0 | 2,3 |
| Employment | growth in % | -0,6 | -0,3 | 0,0 | -0,5 | -0,7 | 0,0 | 0,7 | 0,1 |
| Unemployment rate (LFS) | in % | 6,5 | 7,1 | 8,9 | 7,0 | 6,2 | 7,1 | 9,1 | 7,2 |
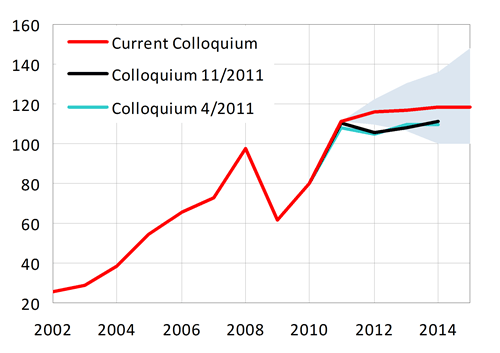
| Wage bill (domestic concept) | nom. growth in % | 0,1 | 1,8 | 4,0 | 1,5 | 0,1 | 2,7 | 4,7 | 2,6 |
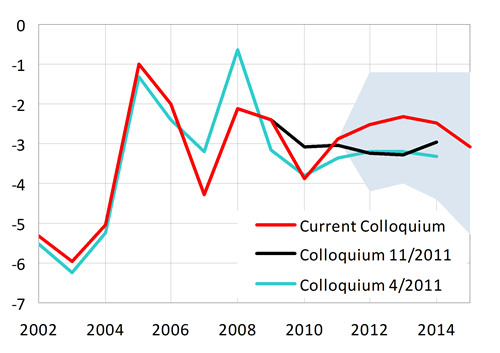
| BoP – current account | in % of GDP | -4,2 | -2,5 | -1,2 | -2,4 | -4,0 | -2,3 | -1,2 | -2,3 |
| 2014 | 2015 | ||||||||
|---|---|---|---|---|---|---|---|---|---|
| min. | average | max. | MoF CR | min. | average | max. | MoF CR | ||
| Assumptions | |||||||||
| GDP of EA12 | real growth in % | 0,3 | 1,2 | 1,8 | 1,4 | 0,3 | 1,3 | 1,9 | 1,8 |
| Crude oil Brent | USD/barrel | 100 | 118 | 136 | 115 | 100 | 118 | 148 | 115 |
| 3M PRIBOR | average in % | 1,3 | 1,8 | 2,4 | 1,3 | 1,5 | 2,4 | 3,1 | 1,5 |
| YTM of 10Y gov. bonds | average in % | 3,5 | 3,9 | 4,2 | 4,0 | 3,6 | 4,1 | 4,4 | 4,4 |
| CZK/EUR exchange rate | 22,0 | 23,6 | 25,0 | 24,7 | 21,3 | 23,4 | 25,0 | 24,6 | |
| USD/EUR exchange rate | 1,23 | 1,30 | 1,35 | 1,30 | 1,19 | 1,27 | 1,30 | 1,30 | |
| Main indicators | |||||||||
| Gross domestic product | real growth in % | 0,0 | 1,9 | 3,0 | 2,2 | 0,0 | 2,0 | 3,5 | 2,8 |
| Contr. of change in inventories | percentage points | -1,2 | -0,2 | 0,3 | 0,2 | -0,5 | 0,0 | 0,2 | 0,2 |
| Contr. of foreign balance | percentage points | -0,1 | 0,7 | 2,4 | 0,8 | 0,0 | 0,7 | 2,4 | 0,5 |
| Consumption of households | real growth in % | -1,0 | 1,3 | 2,6 | 2,0 | -1,0 | 1,2 | 2,8 | 2,8 |
| Consumption of government | real growth in % | -1,8 | 0,0 | 1,7 | -1,8 | -0,2 | 0,3 | 1,0 | -0,2 |
| Fixed capital formation | real growth in % | -1,9 | 1,6 | 3,3 | 2,8 | -1,9 | 1,8 | 3,9 | 3,2 |
| GDP deflator | growth in % | 0,7 | 1,5 | 2,3 | 1,4 | 0,6 | 1,6 | 2,2 | 1,5 |
| Inflation rate (aop) | in % | 1,3 | 2,1 | 3,3 | 1,8 | 1,6 | 2,2 | 3,4 | 2,0 |
| Employment | growth in % | -0,2 | 0,0 | 0,3 | 0,2 | -0,5 | 0,0 | 0,4 | 0,4 |
| Unemployment rate (LFS) | in % | 6,1 | 7,2 | 8,9 | 7,1 | 6,8 | 7,3 | 8,0 | 6,9 |
| Wage bill (domestic concept) | nom. growth in % | 0,2 | 3,0 | 4,7 | 4,7 | 0,2 | 3,2 | 4,6 | 4,4 |
| BoP – current account | in % of GDP | -4,4 | -2,5 | -1,2 | -2,2 | -5,3 | -3,1 | -1,2 | -3,8 |
The main trends of macroeconomic development in 2012 and 2013 can be summed up as follows:
-
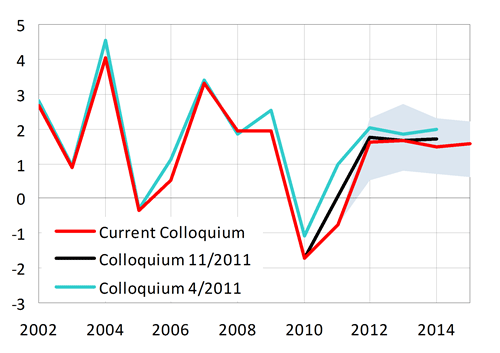
On average, the institutions expect the Czech economy to stagnate this year, with GDP growing by mere 0.1 %. In 2013, economic output should increase by 1.6 %. The MoF forecast is in line with the prognoses of other institutions.
-
Consumer prices will be influenced by changes in indirect taxes, mainly VAT. According to the participating institutions, inflation rate (aop) should reach 3.3 % in 2012 and 2.2 % in 2013. The MoF forecast is of almost the same view.
-
A modest dip in employment, which is on average envisaged by the institutions for this year, should be followed by stagnation in 2013. This development is consistent with the MoF forecast.
-
In participating institutions' view, the unemployment rate should stay slightly above, but close to, 7 % in both 2012 and 2013. The MoF forecast differs from the average of participating institutions' forecasts only marginally.
-
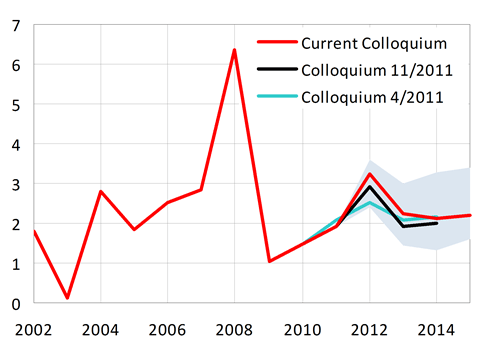
According to the current forecasts, growth of the total wage bill should accelerate from 1.8 % in 2012 to 2.7 % in 2013. The MoF forecast is in line with this tendency, though the wage bill growth is expected to be lower in both years.
The next Colloquium will take place in November 2012.
Overview of indicators
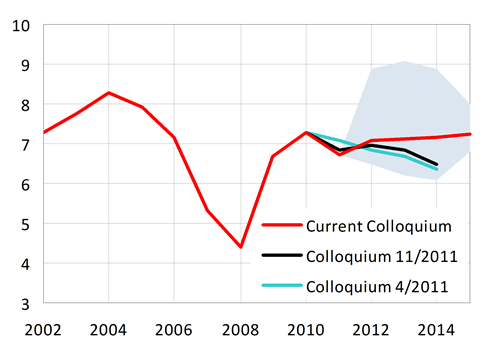
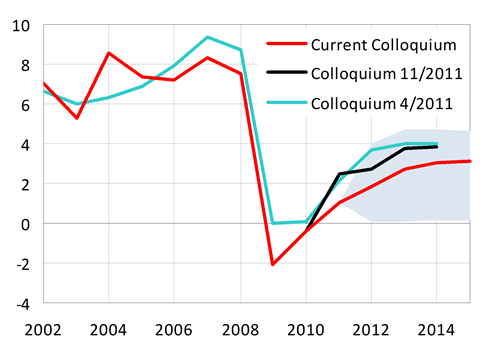
Graphs 1-18 show past and expected development of individual indicators. For comparison, consensus forecasts of two previous Colloquiums are also included. Extreme forecasts of indicators (min. and max. columns in the tables above) form the boundaries of the highlighted area.
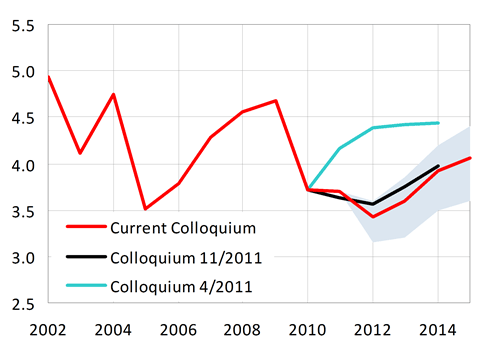
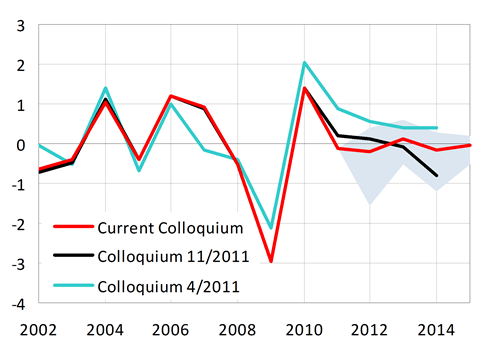
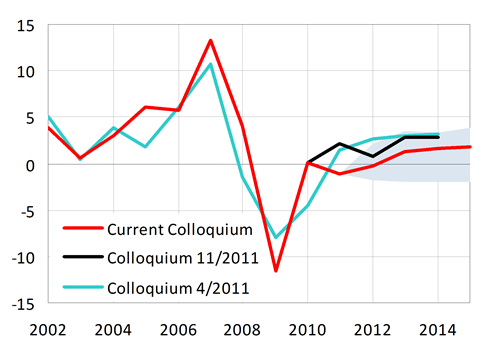
Graph 1: Gross domestic product of EA12
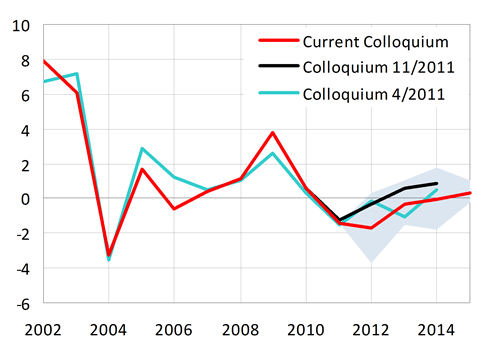
Graph 2: Crude oil Brent
Graph 3: 3M PRIBOR
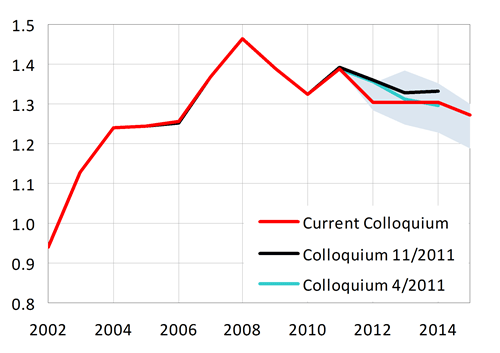
Graph 4: YTM of 10Y government bonds
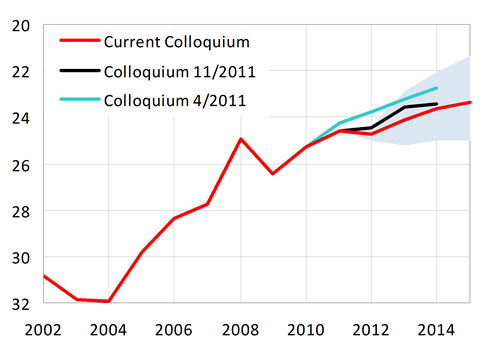
Graph 5: CZK/EUR exchange rate
Graph 6: USD/EUR exchange rate
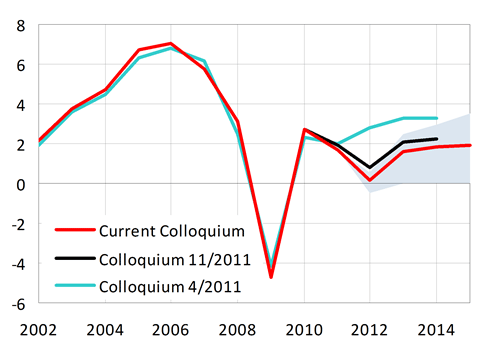
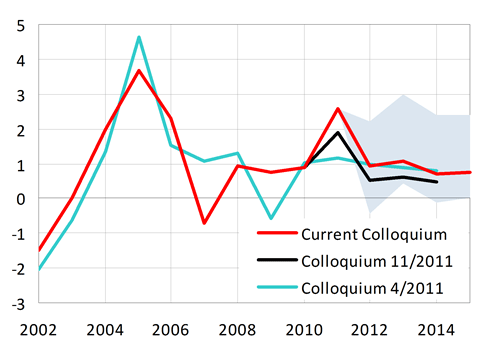
Graph 7: Gross domestic product
Graph 8: Contribution of change in inventories
Graph 9: Contribution of foreign balance
Graph 10: Consumption of households
Graph 11: Consumption of government
Graph 12: Gross fixed capital formation
Graph 13: GDP deflator
Graph 14: Inflation rate (aop)
Graph 15: Employment (LFS)
Graph 16: Unemployment rate (LFS)
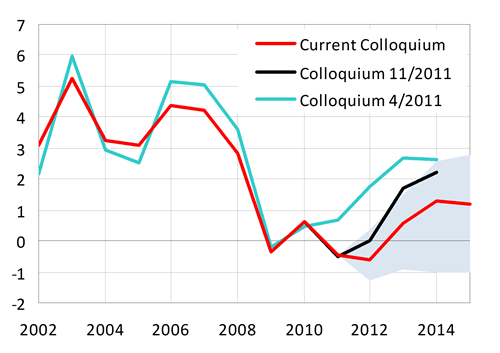
Graph 17: Total wage bill (domestic concept)
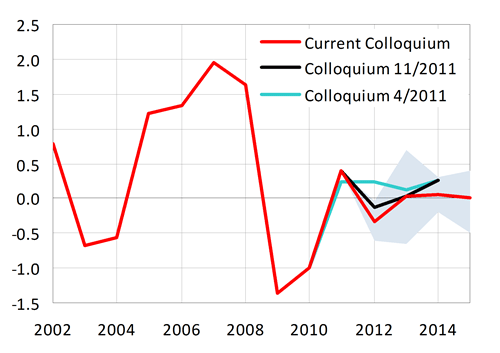
Graph 18: Balance of payments - current account
Graph 1: Gross domestic product of EA12
real growth in %
Graph 2: Crude oil Brent
USD/barrel
Graph 3: 3M PRIBOR
average in %
Graph 4: YTM of 10Y government bonds
average in %
Graph 5: CZK/EUR exchange rate
Graph 6: USD/EUR exchange rate
Graph 7: Gross domestic product
real growth in %
Graph 8: Contribution of change in inventories
percentage points
Graph 9: Contribution of foreign balance
percentage points
Graph 10: Consumption of households
real growth in %
Graph 11: Consumption of government
real growth in %
Graph 12: Gross fixed capital formation
real growth in %
Graph 13: GDP deflator
growth in %
Graph 14: Inflation rate (aop)
in %
Graph 15: Employment (LFS)
growth in %
Graph 16: Unemployment rate (LFS)
in %
Graph 17: Total wage bill (domestic concept)
nominal growth in %
Graph 18: Balance of payments - current account
in % of GDP