Survey of macroeconomic forecasts - April 2011
Survey of macroeconomic forecasts
The macroeconomic scenario of the Convergence programme, macroeconomic frameworks of the State Budget and the Budgetary Outlook and MoF forecasts are regularly compared with the results of macroeconomic indicators survey among important relevant institutions (the so-called Colloquium), last round of which took place in April 2011. The results of the 31st round of the survey are based on the forecasts of 19 institutions (MoF, MPO, MPSV, ČNB, Atlantik, Bank of America Merrill Lynch, CERGE-EI, Cyrrus, Česká spořitelna, ČSOB, IES FSV UK, ING, Komerční banka, Liberální institut, Patria, Generali PPF Asset Management, Raiffeisen, Union of Czech and Moravian Production Co-operatives, UniCredit Bank). To make the survey more representative, the forecast of IMF has been added.
The aim of the Colloquium is to get an idea of opinions regarding the expected development of our economy and to assess the key tendencies within the horizon of the years 2011-2014, with the years 2013 and 2014 seen as an indicative outlook. Key indicators and the last MoF forecast are summed up in Tables 1 and 2.
In general, one can conclude that the basic trends of future developments, envisaged in the current MoF Macroeconomic Forecast, are verified by the forecasts of other institutions.
| 2011 | 2012 | ||||||||
|---|---|---|---|---|---|---|---|---|---|
| min. | average | max. | MoF CR | min. | average | max. | MoF CR | ||
| Assumptions | |||||||||
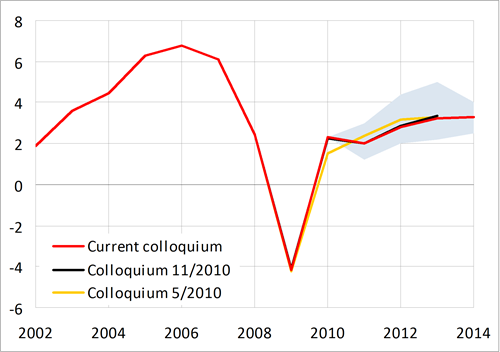
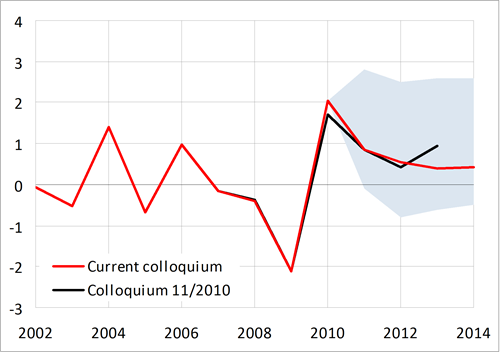
| GDP of EA12 | real growth in % | 1,3 | 1,7 | 2,0 | 1,7 | 1,6 | 1,8 | 2,0 | 2,0 |
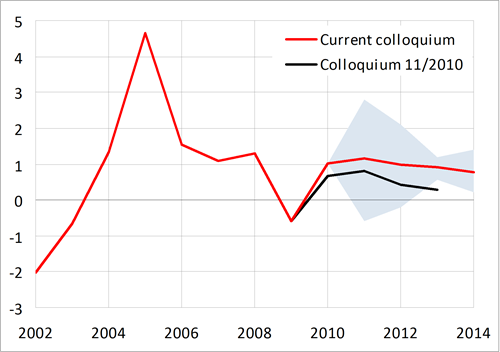
| Crude oil Brent | USD/barrel | 95 | 108 | 125 | 95 | 96 | 105 | 130 | 96 |
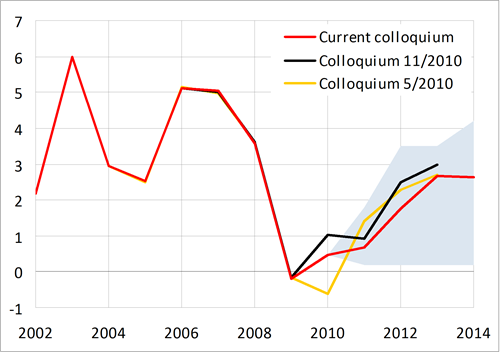
| 3M PRIBOR | average in % | 1,3 | 1,4 | 1,7 | 1,3 | 1,7 | 2,1 | 2,8 | 2,0 |
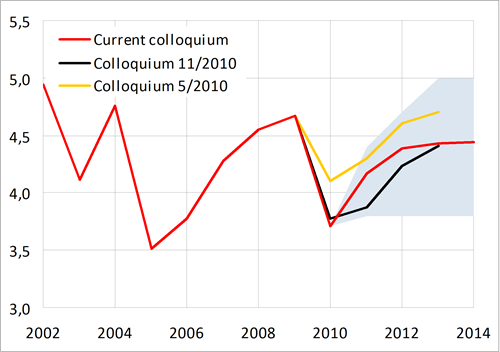
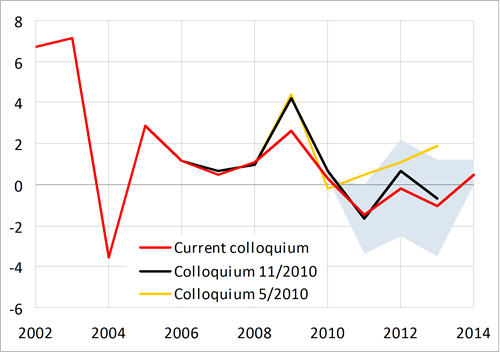
| YTM of 10Y gov. bonds | average in % | 3,8 | 4,2 | 4,4 | 4,1 | 3,8 | 4,4 | 4,7 | 4,3 |
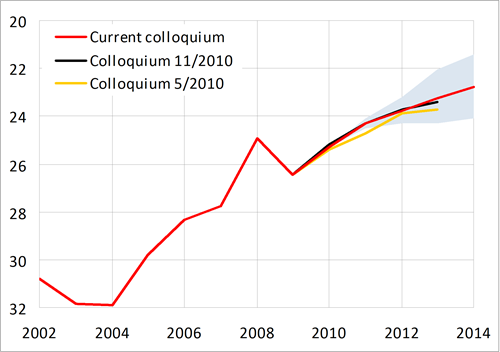
| CZK/EUR exchange rate | 24,1 | 24,3 | 24,5 | 24,1 | 23,2 | 23,8 | 24,3 | 23,5 | |
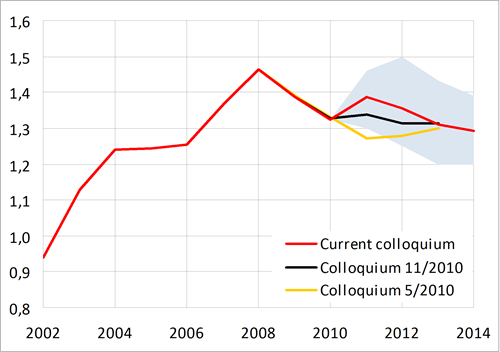
| USD/EUR exchange rate | 1,30 | 1,39 | 1,46 | 1,31 | 1,25 | 1,36 | 1,50 | 1,30 | |
| Main indicators | |||||||||
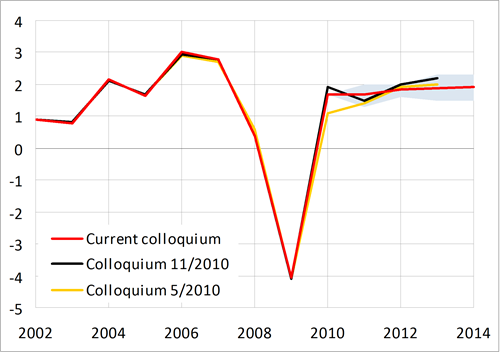
| Gross domestic product | real growth in % | 1,2 | 2,0 | 3,0 | 1,9 | 2,0 | 2,8 | 4,4 | 2,3 |
| Contr. of change in inventories | percentage points | -0,1 | 0,9 | 2,8 | 0,4 | -0,8 | 0,5 | 2,5 | 0,1 |
| Contr. of foreign balance | percentage points | -0,6 | 1,1 | 2,8 | 1,8 | -0,2 | 1,0 | 2,1 | 1,1 |
| Consumption of households | real growth in % | 0,2 | 0,7 | 1,8 | 0,7 | 0,2 | 1,8 | 3,5 | 1,9 |
| Consumption of government | real growth in % | -3,4 | -1,5 | 0,0 | -3,4 | -2,5 | -0,2 | 2,2 | -2,5 |
| Fixed capital formation | real growth in % | -4,0 | 1,5 | 6,4 | 0,7 | -1,0 | 2,7 | 5,4 | 3,2 |
| GDP deflator | growth in % | -1,2 | 1,0 | 4,5 | -0,5 | 1,0 | 2,0 | 5,2 | 2,7 |
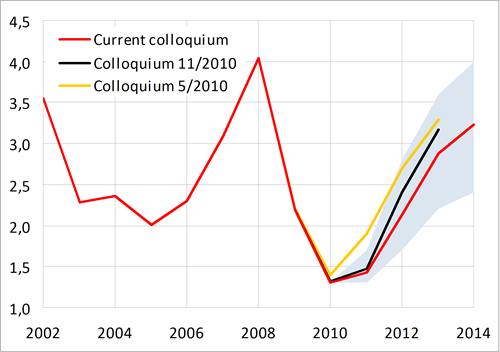
| Inflation rate (aop) | in % | 1,6 | 2,1 | 2,7 | 2,1 | 2,0 | 2,5 | 3,4 | 3,2 |
| Employment | growth in % | -0,2 | 0,2 | 0,6 | 0,2 | -1,5 | 0,2 | 1,0 | 0,5 |
| Unemployment rate (LFS) | in % | 6,7 | 7,1 | 8,0 | 6,9 | 5,9 | 6,8 | 8,5 | 6,5 |
| Wage bill (domestic concept) | nom. growth in % | 1,0 | 2,2 | 3,1 | 2,1 | 0,9 | 3,7 | 5,2 | 4,4 |
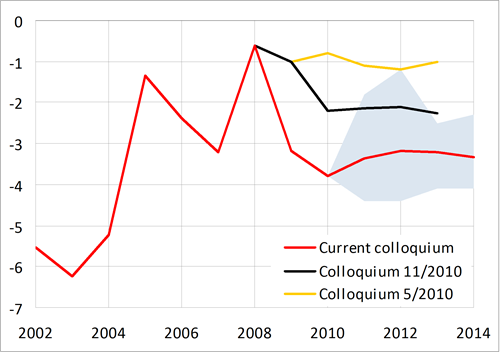
| BoP – current account | in % of GDP | -4,4 | -3,4 | -1,8 | -4,0 | -4,4 | -3,2 | -1,2 | -3,4 |
| 2013 | 2014 | ||||||||
|---|---|---|---|---|---|---|---|---|---|
| min. | average | max. | MoF CR | min. | average | max. | MoF CR | ||
| Assumptions | |||||||||
| GDP of EA12 | real growth in % | 1,5 | 1,9 | 2,3 | 2,3 | 1,5 | 1,9 | 2,3 | 2,3 |
| Crude oil Brent | USD/barrel | 97 | 109 | 120 | 97 | 93 | 110 | 126 | 93 |
| 3M PRIBOR | average in % | 2,2 | 2,9 | 3,6 | 2,6 | 2,4 | 3,2 | 4,0 | 3,0 |
| YTM of 10Y gov. bonds | average in % | 3,8 | 4,4 | 5,0 | 4,3 | 3,8 | 4,4 | 5,0 | 4,3 |
| CZK/EUR exchange rate | 22,1 | 23,2 | 24,3 | 22,8 | 21,4 | 22,8 | 24,1 | 22,2 | |
| USD/EUR exchange rate | 1,20 | 1,31 | 1,43 | 1,30 | 1,20 | 1,29 | 1,39 | 1,30 | |
| Main indicators | |||||||||
| Gross domestic product | real growth in % | 2,2 | 3,2 | 5,0 | 3,3 | 2,5 | 3,3 | 4,0 | 4,0 |
| Contr. of change in inventories | percentage points | -0,6 | 0,4 | 2,6 | 0,0 | -0,5 | 0,4 | 2,6 | 0,0 |
| Contr. of foreign balance | percentage points | 0,6 | 0,9 | 1,2 | 0,6 | 0,2 | 0,8 | 1,4 | 0,2 |
| Consumption of households | real growth in % | 0,2 | 2,7 | 3,5 | 3,3 | 0,2 | 2,6 | 4,2 | 4,2 |
| Consumption of government | real growth in % | -3,5 | -1,0 | 1,2 | -1,3 | 0,0 | 0,5 | 1,2 | 0,1 |
| Fixed capital formation | real growth in % | -0,5 | 3,0 | 5,6 | 5,6 | 0,6 | 3,2 | 7,2 | 7,2 |
| GDP deflator | growth in % | 1,2 | 1,8 | 2,9 | 1,6 | 1,4 | 2,0 | 2,4 | 1,8 |
| Inflation rate (aop) | in % | 1,5 | 2,1 | 2,5 | 1,5 | 1,8 | 2,2 | 3,0 | 2,0 |
| Employment | growth in % | -0,7 | 0,1 | 0,7 | 0,6 | -0,5 | 0,3 | 1,1 | 0,7 |
| Unemployment rate (LFS) | in % | 6,0 | 6,7 | 8,3 | 6,1 | 5,5 | 6,4 | 7,0 | 5,5 |
| Wage bill (domestic concept) | nom. growth in % | 0,9 | 4,0 | 5,5 | 4,9 | 1,0 | 4,0 | 5,9 | 5,9 |
| BoP – current account | in % of GDP | -4,1 | -3,2 | -2,5 | -3,6 | -4,1 | -3,3 | -2,3 | -4,1 |
The main trends in macroeconomic development can be summed up as follows:
-
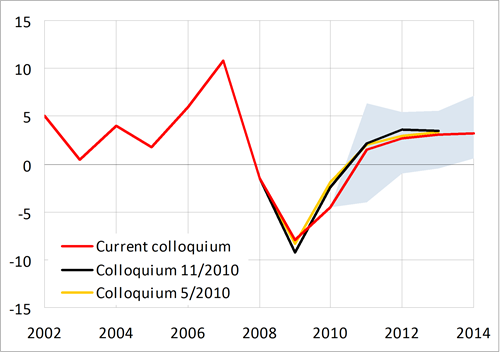
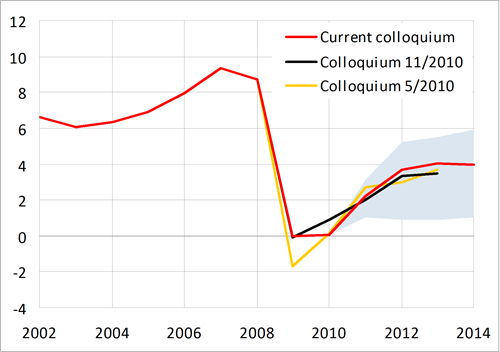
On average, the institutions expect GDP to grow by 2.0 % in 2011. For 2012, an acceleration to 2.8 % is envisaged. The MoF forecast is in line with this trend, though it is more conservative for the year 2012. In the following years, economic growth should accelerate to 3.3 % in 2014.
-
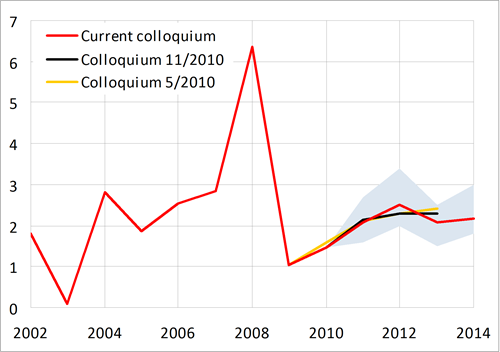
Inflation rate should stay within the tolerance band of the CNB’s inflation target in the whole forecasting horizon. The question is to what extent have the institutions taken into account the announced changes in indirect taxes, which are supposed to come into force in 2012 and 2013.
-
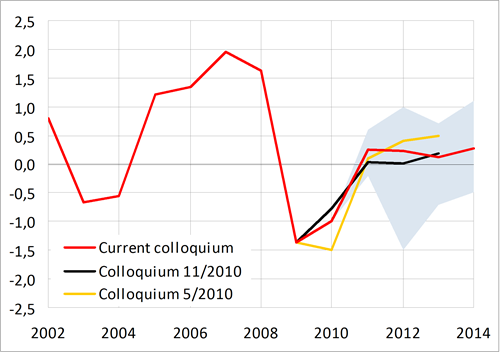
Economic recovery should be driven by labour productivity growth, with creation of jobs remaining limited. In the period 2011–2014, annual growth of employment shouldn’t exceed 0.3 %, according to the forecasts‘ average. For the year 2011, the MoF forecast fully corresponds to other institutions‘ forecasts, for the following years it envisages somewhat higher growth rates of employment.
-
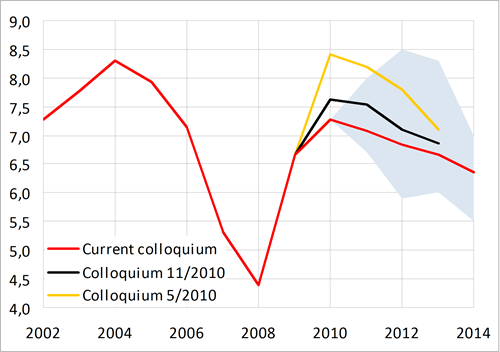
Unemployment rate, which apparently peaked in 2010 (in annual terms), should fall to 7.1 % this year. In the following years, unemployment rate should continue to decline moderately. The MoF forecast is in line with this trend.
-
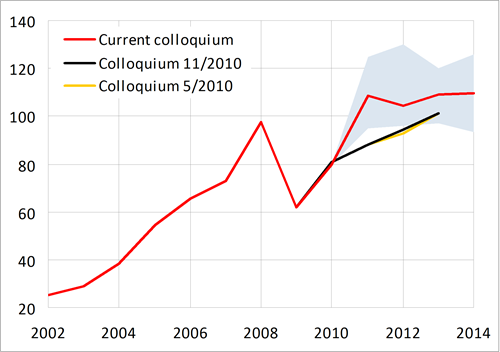
After having stagnated in 2009 and 2010, total wage bill should rise by 2.2 % this year, according to current forecasts. In the years to come, its growth dynamics is expected to accelerate to 4.0 % in 2013. In 2014, total wage bill should continue to grow at a similar pace. For the years 2012–2014, the MoF forecast envisages faster growth of total wage bill.
The next Colloquium will take place in November 2011.
Overview of indicators
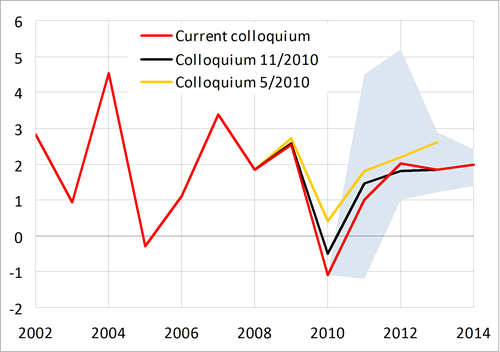
The depiction of past and expected developments of individual indicators is shown in graphs 1-18. For the sake of comparison, consensus forecasts of two previous Colloquiums are also included. Extreme forecasts of indicators (min. and max. columns in the tables) form the boundaries of the highlighted area.
Graph 1: Gross domestic product of EA12
Graph 2: Crude oil Brent
Graph 3: 3M PRIBOR
Graph 4: YTM of 10Y government bonds
Graph 5: CZK/EUR exchange rate
Graph 6: USD/EUR exchange rate
Graph 7: Gross domestic product
Graph 8: Contribution of change in inventories
Graph 9: Contribution of foreign balance
Graph 10: Consumption of households
Graph 11: Consumption of government
Graph 12: Gross fixed capital formation
Graph 13: GDP deflator
Graph 14: Inflation rate (aop)
Graph 15: Employment (LFS)
Graph 16: Unemployment rate (LFS)
Graph 17: Total wage bill (domestic concept)
Graph 18: Balance of payments - current account
Graph 1: Gross domestic product of EA12
real growth in %
Graph 2: Crude oil Brent
USD/barrel
Graph 3: 3M PRIBOR
average in %
Graph 4: YTM of 10Y government bonds
average in %
Graph 5: CZK/EUR exchange rate
Graph 6: USD/EUR exchange rate
Graph 7: Gross domestic product
real growth in %
Graph 8: Contribution of change in inventories
percentage points
Graph 9: Contribution of foreign balance
percentage points
Graph 10: Consumption of households
real growth in %
Graph 11: Consumption of government
real growth in %
Graph 12: Gross fixed capital formation
real growth in %
Graph 13: GDP deflator
growth in %
Graph 14: Inflation rate (aop)
in %
Graph 15: Employment (LFS)
growth in %
Graph 16: Unemployment rate (LFS)
in %
Graph 17: Total wage bill (domestic concept)
nominal growth in %
Graph 18: Balance of payments - current account
in % of GDP