Survey of macroeconomic forecasts - November 2010
Survey of macroeconomic forecasts
Macroeconomic frameworks of the State Budget and the Budgetary Outlook and MoF forecasts are regularly compared with the results of macroeconomic indicators survey among important relevant institutions (the so-called Colloquium), last round of which took place in November 2010. Outcomes of the 30th round of the survey are based on the forecasts of 15 institutions (Atlantic, Bank of America Merrill Lynch, CERGE-EI, ČNB, ČSOB, Generali PPF Asset Management, ING, Komerční banka, MF ČR, MPO, MPSV, Patria, Raiffeisen, Union of Czech and Moravian Production Co-operatives, UniCredit). To make the survey more representative, the forecasts of two international institutions were added (IMF, OECD).
The aim of the Colloquium is to get an idea of opinions regarding the expected development of our economy and to assess the key tendencies within the horizon of the years 2010-2013, with the years 2012 and 2013 seen as an indicative outlook. Key indicators and the last MoF forecast are summed up in Tables 1 and 2.
In general, one can conclude that with minor exceptions, the MoF forecast does not differ considerably from the average of other institutions' forecasts.
| 2010 | 2011 | ||||||||
|---|---|---|---|---|---|---|---|---|---|
| min. | average | max. | MoF CR | min. | average | max. | MoF CR | ||
| Assumptions | |||||||||
| GDP of EA12 | real growth in % | 1,6 | 1,9 | 2,6 | 1,6 | 0,9 | 1,5 | 2,0 | 1,5 |
| Crude oil Brent | USD/barrel | 78 | 81 | 85 | 78 | 82 | 88 | 95 | 84 |
| 3M PRIBOR | average in % | 1,2 | 1,3 | 1,6 | 1,3 | 1,2 | 1,5 | 2,3 | 1,3 |
| YTM of 10Y gov. bonds | average in % | 3,4 | 3,8 | 3,9 | 3,7 | 3,4 | 3,9 | 4,3 | 3,9 |
| CZK/EUR exchange rate | 24,8 | 25,2 | 25,3 | 25,3 | 23,9 | 24,3 | 24,8 | 24,2 | |
| USD/EUR exchange rate | 1,30 | 1,33 | 1,35 | 1,31 | 1,29 | 1,34 | 1,42 | 1,30 | |
| Main indicators | |||||||||
| Gross domestic product | real growth in % | 1,8 | 2,2 | 2,7 | 2,2 | 1,1 | 2,0 | 2,8 | 2,0 |
| Contr. of change in inventories | percentage points | 1,2 | 1,7 | 2,6 | 1,4 | 0,0 | 0,9 | 2,1 | 0,4 |
| Contr. of foreign balance | percentage points | -0,1 | 0,7 | 1,4 | 0,7 | -1,0 | 0,8 | 1,6 | 1,5 |
| Consumption of households | real growth in % | 0,1 | 1,0 | 1,8 | 1,5 | -0,3 | 0,9 | 2,1 | 1,5 |
| Consumption of government | real growth in % | -0,5 | 0,7 | 1,9 | 0,2 | -5,9 | -1,7 | 1,2 | -4,5 |
| Fixed capital formation | real growth in % | -4,9 | -2,4 | 0,5 | -3,0 | -0,4 | 2,1 | 5,8 | 1,3 |
| GDP deflator | growth in % | -1,2 | -0,5 | 0,7 | -0,5 | 0,6 | 1,5 | 2,2 | 1,3 |
| Inflation rate (aop) | in % | 1,2 | 1,5 | 1,6 | 1,5 | 1,8 | 2,1 | 2,7 | 2,2 |
| Employment | growth in % | -1,2 | -0,8 | 0,2 | -1,2 | -2,0 | 0,0 | 0,8 | 0,8 |
| Unemployment rate (LFS) | in % | 7,2 | 7,6 | 8,7 | 7,4 | 6,6 | 7,5 | 8,5 | 7,2 |
| Wage bill (domestic concept) | nom. growth in % | -0,5 | 0,9 | 3,0 | 0,5 | -0,5 | 2,0 | 3,8 | 3,4 |
| BoP – current account | in % of GDP | -3,5 | -2,2 | -1,1 | -1,4 | -3,5 | -2,1 | -0,6 | -1,1 |
| 2012 | 2013 | ||||||
|---|---|---|---|---|---|---|---|
| min. | average | max. | min. | average | max. | ||
| Assumptions | |||||||
| GDP of EA12 | real growth in % | 1,2 | 2,0 | 3,2 | 1,5 | 2,2 | 3,5 |
| Crude oil Brent | USD/barrel | 89 | 94 | 105 | 85 | 101 | 120 |
| 3M PRIBOR | average in % | 1,8 | 2,4 | 3,5 | 2,3 | 3,2 | 3,6 |
| YTM of 10Y gov. bonds | average in % | 3,9 | 4,2 | 4,6 | 4,1 | 4,4 | 4,8 |
| CZK/EUR exchange rate | 23,1 | 23,7 | 24,6 | 22,2 | 23,4 | 24,4 | |
| USD/EUR exchange rate | 1,22 | 1,31 | 1,41 | 1,28 | 1,31 | 1,37 | |
| Main indicators | |||||||
| Gross domestic product | real growth in % | 1,4 | 2,9 | 4,5 | 2,7 | 3,4 | 4,0 |
| Contr. of change in inventories | percentage points | -0,3 | 0,4 | 2,5 | 0,0 | 0,9 | 2,5 |
| Contr. of foreign balance | percentage points | -1,5 | 0,4 | 1,0 | -0,8 | 0,3 | 1,0 |
| Consumption of households | real growth in % | 0,9 | 2,5 | 4,0 | 1,3 | 3,0 | 3,6 |
| Consumption of government | real growth in % | -1,7 | 0,7 | 2,2 | -3,5 | -0,7 | 1,4 |
| Fixed capital formation | real growth in % | -0,2 | 3,6 | 6,2 | 0,6 | 3,5 | 5,6 |
| GDP deflator | growth in % | 1,1 | 1,8 | 2,1 | 1,3 | 1,9 | 2,6 |
| Inflation rate (aop) | in % | 1,7 | 2,3 | 2,8 | 2,0 | 2,3 | 2,8 |
| Employment | growth in % | -1,6 | 0,0 | 0,7 | -0,6 | 0,2 | 0,8 |
| Unemployment rate (LFS) | in % | 6,7 | 7,1 | 7,9 | 6,5 | 6,9 | 7,2 |
| Wage bill (domestic concept) | nom. growth in % | -0,4 | 3,3 | 5,4 | -0,2 | 3,5 | 5,5 |
| BoP – current account | in % of GDP | -3,5 | -2,1 | -0,7 | -3,5 | -2,3 | -1,1 |
The main tendencies of macroeconomic development can be summed up as follows:
-
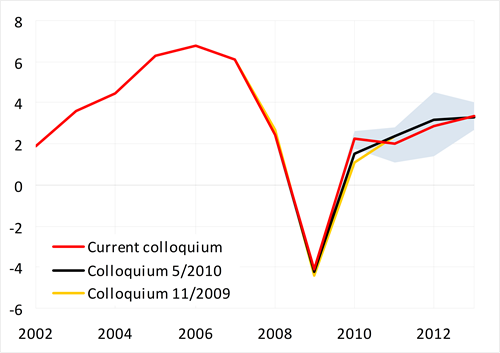
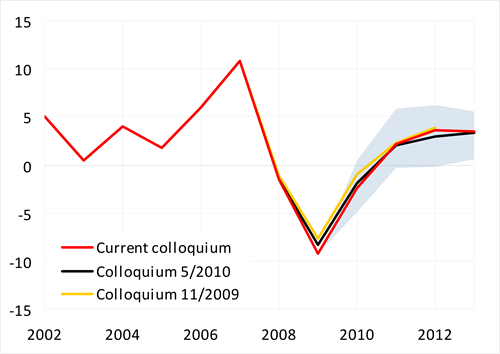
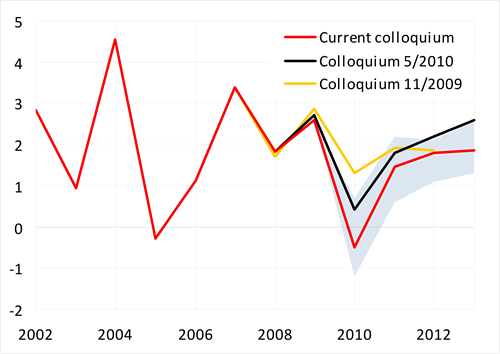
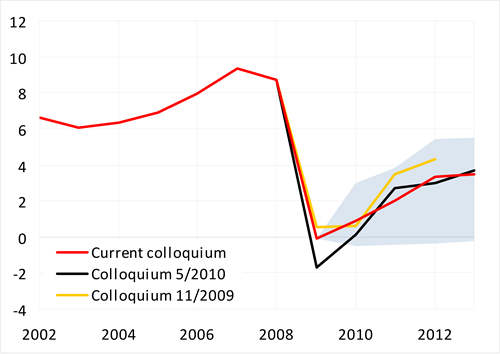
On average, the institutions expect the GDP growth to reach 2.2 % in 2010. For 2011, they envisage a minor slowdown to 2.0 %. The MoF forecast fully corresponds to the forecasts' average. From 2012 on, the economic growth should accelerate to 3.4 % in 2013.
-
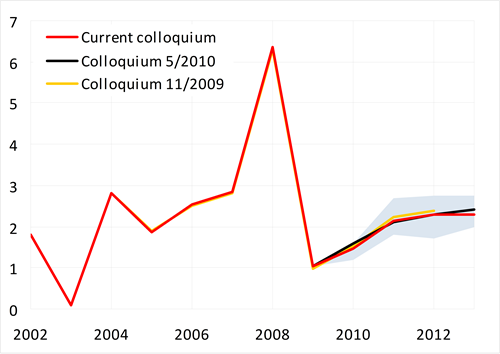
Inflation expectations have proven to be well anchored. Over the entire forecasting horizon, the average rate of inflation should remain at low levels close to the CNB's inflation target. The MoF forecast is in accord with the forecasts' average.
-
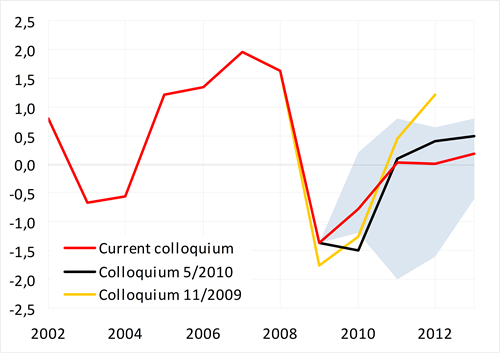
The economic recovery should be driven by labour productivity growth, with the creation of jobs remaining limited. According to the forecasts' average, employment should fall by 0.8 % this year, stagnate in 2011 and 2012, and grow by modest 0.2 % in 2013. Compared with the average of other institutions' forecasts, the MoF envisages more substantial drop in 2010 and, on the contrary, faster growth (0.6-0.8 %) in the years to come.
-
This year, the unemployment rate should reach its peak at 7.6 % (yearly average). In the years to come, it should be declining only gradually. The MoF forecast is roughly in accord with the forecasts' average.
-
After the total wage bill stagnated last year, it is expected to rise by 0.9 % this year, according to the current forecasts. The growth is assumed to be gaining pace in the years 2011-2013; however, the growth dynamics should not reach the pre-2009 levels. The MoF expects slower growth in 2010, while in the years to come it assumes the total wage bill to expand faster, compared with the forecasts' average.
The next Colloquium will take place in May 2011.
List of indicators:
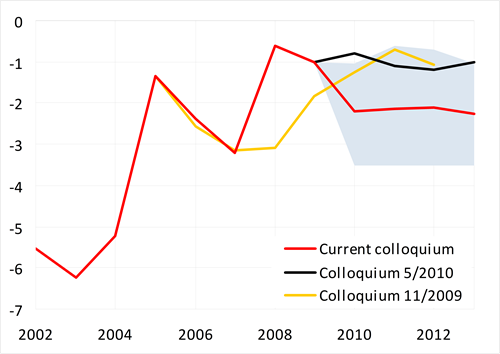
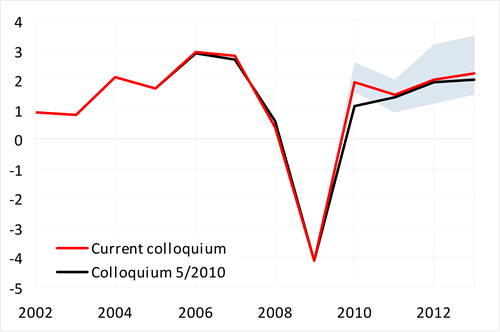
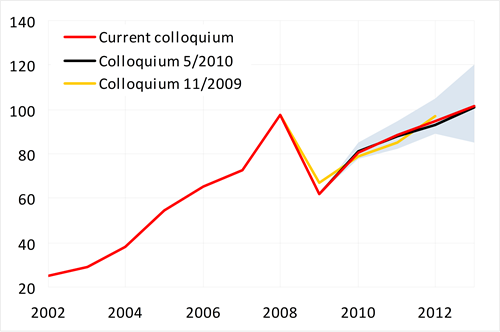
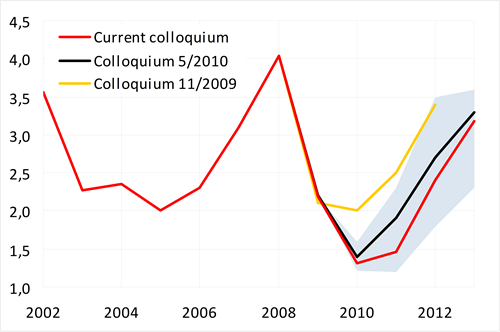
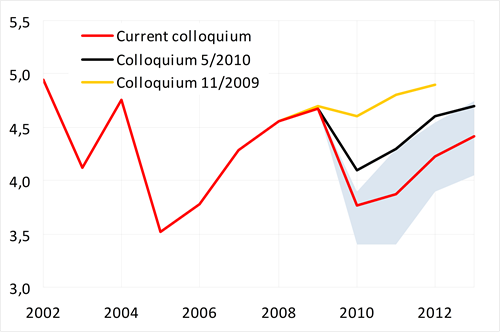
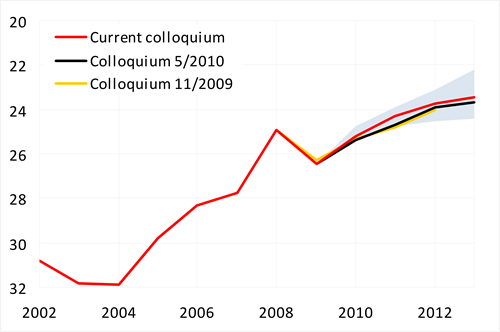
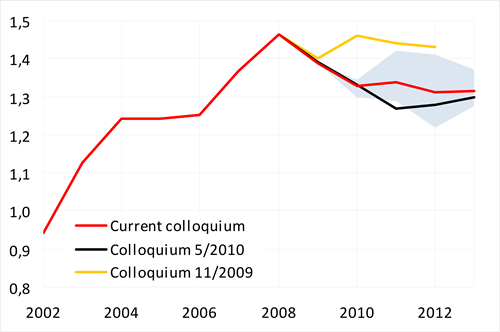
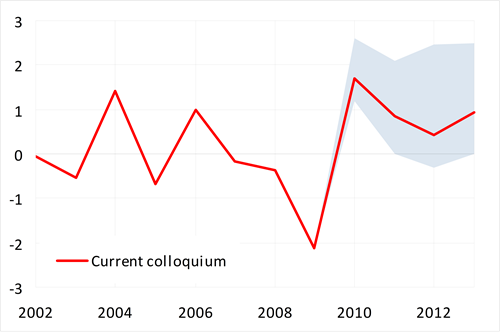
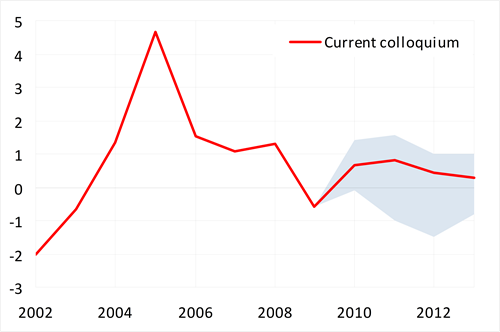
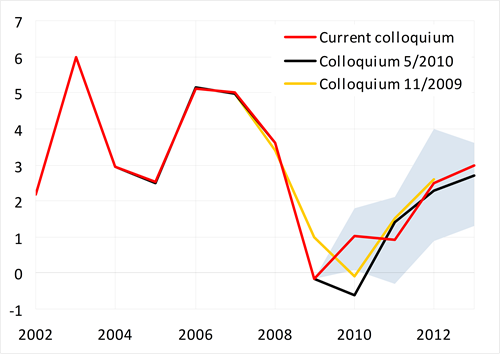
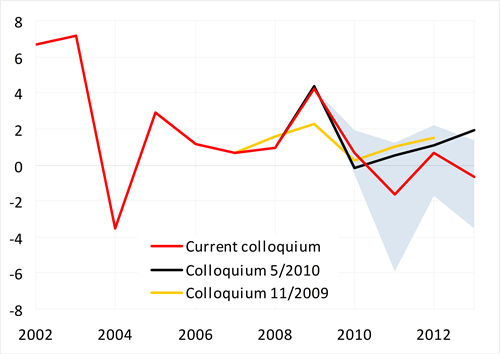
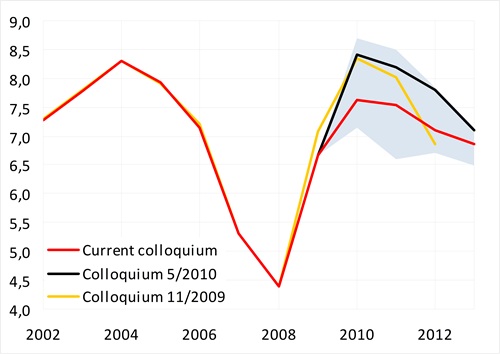
Graphic presentation of past and assumed developments of individual indicators is seen in graphs 1-18. For the sake of comparison, also consensus forecasts of two previous Colloquiums are included. Extreme forecasts of indicators (min. and max. columns in the tables) form thresholds of the highlighted area.
Graph 1: Gross domestic product of EA12 countries
Graph 2: Crude oil Brent
Graph 3: 3M PRIBOR
Graph 4: YTM of 10Y government bonds
Graph 5: CZK/EUR exchange rate
Graph 6: USD/EUR exchange rate
Graph 7: Gross domestic product
Graph 8: Contribution of change in inventories
Graph 9: Contribution of foreign balance
Graph 10: Consumption of households
Graph 11: Consumption of government
Graph 12: Gross fixed capital formation
Graph 13: GDP deflator
Graph 14: Inflation rate (aop)
Graph 15: Employment (LFS)
Graph 16: Unemployment rate (LFS)
Graph 17: Total wage bill (domestic concept)
Graph 18: Balance of payments - current account
Graph 1: Gross domestic product of EA12 countries
real growth in %
Graph 2: Crude oil Brent
USD/barrel
Graph 3: 3M PRIBOR
average in %
Graph 4: YTM of 10Y government bonds
average in %
Graph 5: CZK/EUR exchange rate
Graph 6: USD/EUR exchange rate
Graph 7: Gross domestic product
real growth in %
Graph 8: Contribution of change in inventories
percentage points
Graph 9: Contribution of foreign balance
percentage points
Graph 10: Consumption of households
real growth in %
Graph 11: Consumption of government
real growth in %
Graph 12: Gross fixed capital formation
real growth in %
Graph 13: GDP deflator
growth in %
Graph 14: Inflation rate (aop)
in %
Graph 15: Employment (LFS)
growth in %
Graph 16: Unemployment rate (LFS)
in %
Graph 17: Total wage bill (domestic concept)
nominal growth in %
Graph 18: Balance of payments - current account
in % of GDP