Survey of macroeconomic forecasts - May 2010
Macroeconomic forecasts' survey
Macroeconomic frameworks of the State Budget and Budgetary Outlook and MoF forecasts are regularly compared with results of macroeconomic indicators survey among important relevant institutions (the so-called Colloquium), last round of which took place in May 2010. Outcomes of the 29th round of survey are based on forecasts of 15 domestic institutions (Cyrrus, CNB, Česká spořitelna, ČSOB, Czech Chamber of Commerce, Komerční banka, MoF, Ministry of Labour and Social Affairs, Patria, PPF, Raiffeisen, Union of Czech and Moravian Production Co-operatives, UniCredit, Wood & Company). To make the survey more representative, forecasts of two international institutions were added (European Commission, IMF).
The Colloquium’s aim was to get an idea on opinions regarding assumed development of our economy and to assess jointly key tendencies within the horizon of years 2010 through 2013, with years 2012 and 2013 seen as indicative outlook. The key indicators and current MoF forecast are summed up in Tables 1 and 2.
In general it can be summed up that, with minor exceptions, MoF forecasts do not differ considerably from average of other institutions’ forecasts.
| 2010 | 2011 | ||||||||
|---|---|---|---|---|---|---|---|---|---|
| min. | consensus | max. | MoF CR | min. | consensus | max. | MoF CR | ||
| Gross domestic product | increase in %, const.pr. | 0,8 | 1,5 | 1,9 | 1,5 | 1,7 | 2,4 | 3,1 | 2,4 |
| Consumption of households | increase in %, const.pr. | -1,5 | -0,6 | 0,7 | -1,1 | 0,3 | 1,4 | 2,8 | 2,0 |
| Consumption of government | increase in %, const.pr. | -3,0 | -0,2 | 5,2 | -2,5 | -1,8 | 0,5 | 5,1 | -0,9 |
| Fixed capital formation | increase in %, const.pr. | -6,5 | -1,9 | 3,0 | -3,7 | -3,2 | 2,0 | 4,5 | 2,5 |
| Inflation rate | per cent | 1,4 | 1,6 | 2,0 | 1,5 | 1,8 | 2,1 | 2,9 | 2,3 |
| GDP deflator | increase in %, const.pr. | -2,1 | 0,4 | 1,5 | 0,2 | 0,6 | 1,8 | 2,7 | 1,1 |
| Employment | increase in per cent | -2,4 | -1,5 | -0,6 | -0,6 | -2,2 | 0,1 | 1,0 | 0,1 |
| Unemployment rate | average in per cent | 7,4 | 8,4 | 9,5 | 7,9 | 7,2 | 8,2 | 9,2 | 7,8 |
| Wage Bill (domestic concept) | increase in %, curr.pr. | -2,0 | 0,1 | 3,0 | -0,1 | -0,5 | 2,7 | 5,3 | 4,3 |
| Current account / GDP | per cent | -2,1 | -0,8 | 0,4 | 0,4 | -2,4 | -1,1 | 1,0 | -0,5 |
| Crude oil Brent | USD / barrel | 75 | 81 | 85 | 81 | 75 | 88 | 105 | 92 |
| 2012 | 2013 | ||||||
|---|---|---|---|---|---|---|---|
| min. | consensus | max. | min. | consensus | max. | ||
| Gross domestic product | increase in %, const.pr. | 1,9 | 3,2 | 4,2 | 2,1 | 3,3 | 4,4 |
| Consumption of households | increase in %, const.pr. | 1,2 | 2,3 | 4,0 | 1,3 | 2,7 | 4,0 |
| Consumption of government | increase in %, const.pr. | -0,7 | 1,1 | 5,1 | -1,0 | 1,9 | 5,1 |
| Fixed capital formation | increase in %, const.pr. | -0,5 | 3,0 | 5,0 | 0,6 | 3,3 | 6,4 |
| Inflation rate | per cent | 1,9 | 2,3 | 2,8 | 1,9 | 2,4 | 2,9 |
| GDP deflator | increase in %, const.pr. | 1,5 | 2,2 | 2,9 | 1,5 | 2,6 | 3,6 |
| Employment | increase in per cent | -1,9 | 0,4 | 1,8 | -1,9 | 0,5 | 1,8 |
| Unemployment rate | average in per cent | 6,7 | 7,8 | 9,0 | 6,4 | 7,1 | 7,5 |
| Wage Bill (domestic concept) | increase in %, curr.pr. | -0,4 | 3,0 | 6,8 | -0,4 | 3,7 | 7,4 |
| Current account / GDP | per cent | -1,7 | -1,2 | 0,5 | -2,0 | -1,0 | 0,5 |
| Crude oil Brent | USD / barrel | 80 | 93 | 108 | 80 | 101 | 110 |
Main tendencies of macroeconomic developments can be summed up as follows:
-
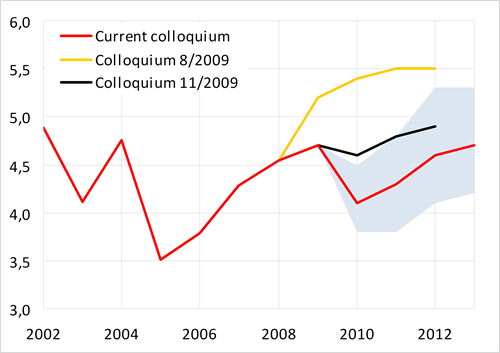
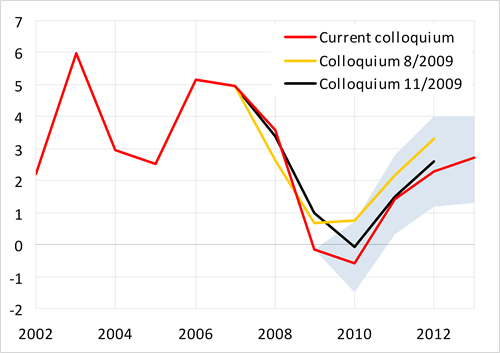
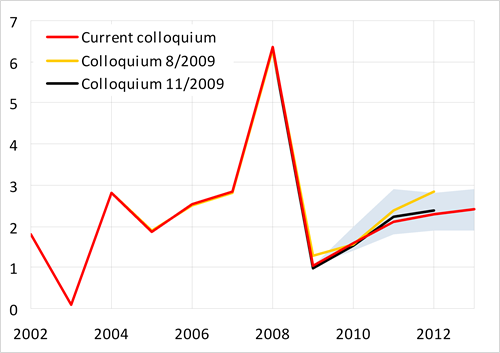
On average, institutions expect that GDP growth will reach 1.5 % in 2010. For 2011 growth is expected to accelerate to 2.4 %. MoF forecast for both years corresponds fully to the consensus forecast. Outlook for years 2012 and 2013 then allows for roughly 3 % growth of the economy.
-
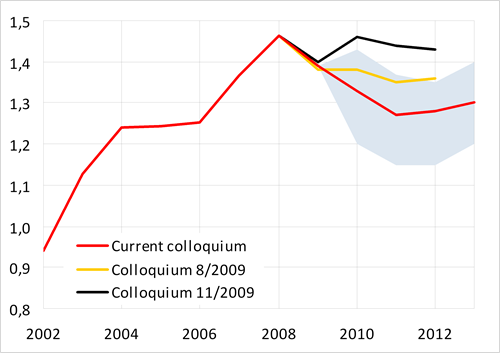
Within entire forecast horizon, average rate of inflation should stick to low levels, close to CNB’s inflation target. The MoF forecast is in accordance with forecasts’ average.
-
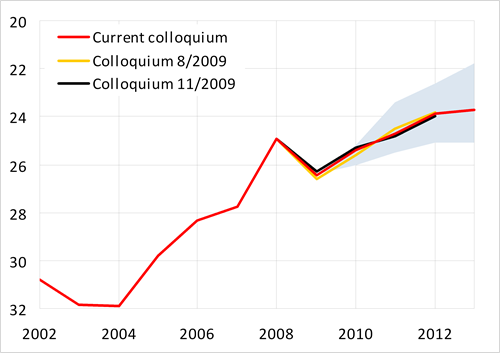
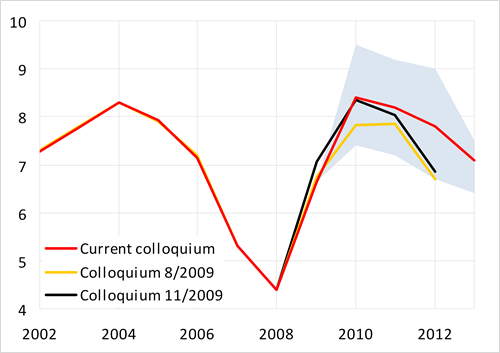
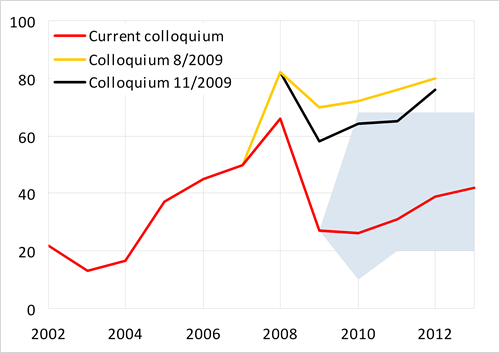
According to consensus forecast, decline in employment and rise in unemployment rate should continue in this year. In 2011 employment should increase marginally by 0.1 %, with unemployment rate falling moderately. Such tendencies (growth of employment, fall in unemployment rate) should prevail on the labour market also in 2012 and 2013 according to forecasts’ average, which is in accordance with MoF estimate.
-
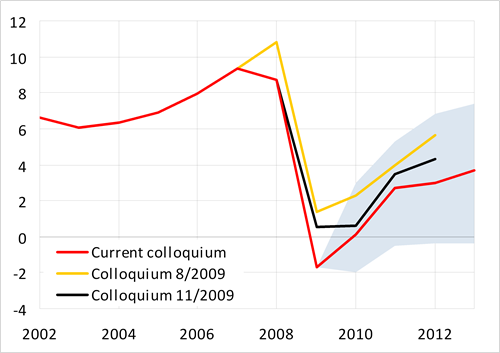
Current forecasts allow for decline in wage bill (in current prices) to stop as soon as this year. In 2011 this indicator should rise by 2.7 %, which is by 1.6 p.p. less than forecast by the MoF. Outlook for 2012 and 2013 allows for further acceleration of growth dynamics, which nevertheless should not reach the pre-2009 level.
The next Colloquium will take place in November 2010.
List of indicators:
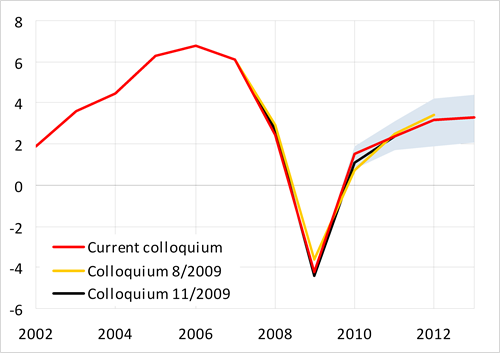
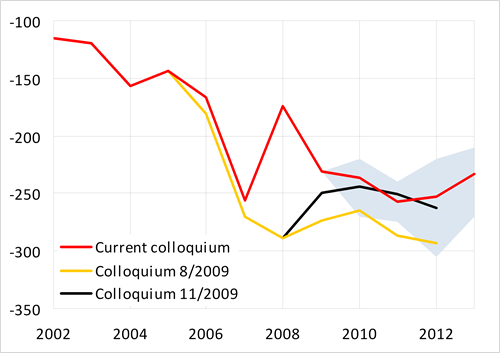
Graphic presentation of past and assumed developments of individual indicators is seen in graphs 1–19. For the sake of comparison, also consensus forecasts of two previous Colloquiums are included. Extreme forecasts of indicators (min. and max. columns in the tables) form thresholds of the highlighted area.
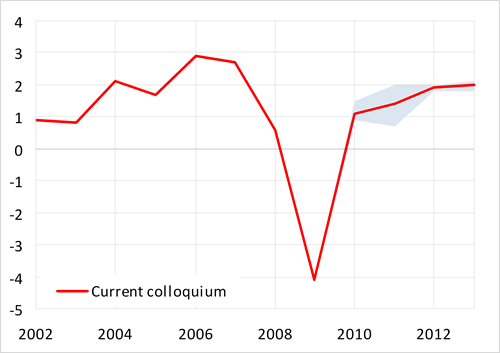
Graph 1: Gross domestic product of EA12 countries
Graph 2: Price of Brent oil
Graph 3: Short-term interest rates
Graph 4: Long-term interest rates
Graph 5: CZK/EUR exchange rate
Graph 6: USD/EUR exchange rate
Graph 7: Gross domestic product
Graph 8: Consumption of households
Graph 9: Consumption of government
Graph 10: Gross fixed capital formation
Graph 11: GDP deflator
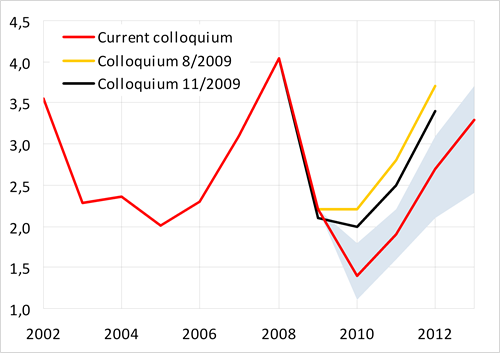
Graph 12: Consumer prices
Graph 13: Employment (LFS)
Graph 14: Unemployment rate (LFS)
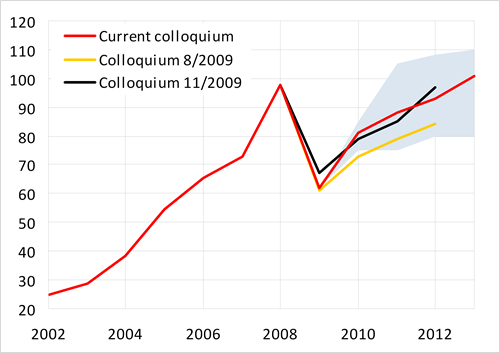
Graph 15: Total wage bill (domestic concept)
Graph 16: Trade balance
Graph 17: Balance of services
Graph 18: Balance of income
Graph 19: Balance of payments – current account
Graph 1: Gross domestic product of EA12 countries
Real growth in %
Graph 2: Price of Brent oil
USD/barrel
Graph 3: Short-term interest rates
% p. a.
Graph 4: Long-term interest rates
% p. a.
Graph 5: CZK/EUR exchange rate
Graph 6: USD/EUR exchange rate
Graph 7: Gross domestic product
Real growth in %
Graph 8: Consumption of households
Real growth in %
Graph 9: Consumption of government
Real growth in %
Graph 10: Gross fixed capital formation
Real growth in %
Graph 11: GDP deflator
Growth in %
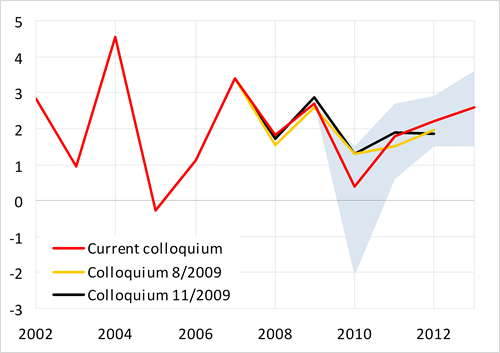
Graph 12: Consumer prices
Average rate of inflation in %
Graph 13: Employment (LFS)
Growth in %
.png)
Graph 14: Unemployment rate (LFS)
In %
Graph 15: Total wage bill (domestic concept)
Nominal growth in %
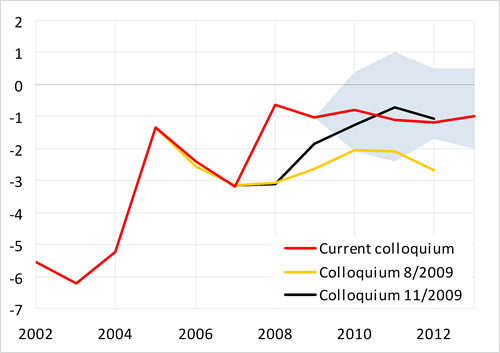
Graph 16: Trade balance
fob-fob – BoP, CZK bn
.png)
Graph 17: Balance of services
CZK bn
Graph 18: Balance of income
CZK bn
Graph 19: Balance of payments – current account
% of GDP