Survey of macroeconomic forecasts - November 2011
Survey of macroeconomic forecasts
The macroeconomic scenario of the Convergence programme, macroeconomic frameworks of the State Budget and the Budgetary Outlook and MoF forecasts are regularly compared with the results of macroeconomic indicators survey among important relevant institutions (the so-called Colloquium). The results of the 32nd Colloquium, which took place in November 2011, are based on the forecasts of 17 institutions (MoF, MPO, MPSV, CNB, CERGE-EI, Cyrrus, Ceska sporitelna, CSOB, IES FSV UK, ING, Komercni banka, Liberalni institut, Patria, Generali PPF Asset Management, Raiffeisenbank, Confederation of Industry of the Czech Republic, UniCredit Bank). To make the survey more representative, the forecasts of the EC, IMF and OECD have been added.
The aim of the Colloquium was to get an idea of opinions regarding the expected development of our economy and to assess the key tendencies within the horizon of the years 2011-2014, with the years 2013 and 2014 seen as an indicative outlook. Key indicators and the last MoF forecast are summed up in Tables 1 and 2.
In general, one can conclude that the basic trends of future developments, envisaged in the current MoF Macroeconomic Forecast, are verified by the forecasts of other institutions.
| 2011 | 2012 | ||||||||
|---|---|---|---|---|---|---|---|---|---|
| min. | average | max. | MoF CR | min. | average | max. | MoF CR | ||
| Assumptions | |||||||||
| GDP of EA12 | real growth in % | 1,1 | 1,5 | 1,8 | 1,7 | -1,0 | 0,3 | 1,0 | 1,0 |
| Crude oil Brent | USD/barrel | 100 | 110 | 115 | 110 | 95 | 105 | 120 | 107 |
| 3M PRIBOR | average in % | 1,0 | 1,2 | 1,5 | 1,2 | 0,9 | 1,1 | 1,5 | 1,1 |
| YTM of 10Y gov. bonds | average in % | 3,1 | 3,6 | 3,8 | 3,7 | 3,0 | 3,6 | 3,9 | 3,7 |
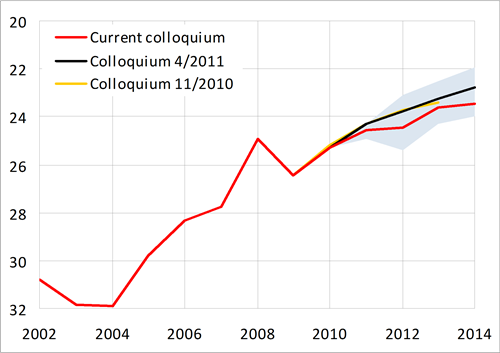
| CZK/EUR exchange rate | 24,3 | 24,6 | 24,9 | 24,3 | 23,1 | 24,4 | 25,4 | 23,9 | |
| USD/EUR exchange rate | 1,38 | 1,39 | 1,42 | 1,39 | 1,32 | 1,36 | 1,45 | 1,35 | |
| Main indicators | |||||||||
| Gross domestic product | real growth in % | 1,4 | 1,9 | 2,1 | 2,1 | -1,2 | 0,8 | 2,1 | 1,0 |
| Contr. of change in inventories | percentage points | -0,4 | 0,2 | 0,5 | 0,5 | -0,4 | 0,1 | 1,5 | 0,0 |
| Contr. of foreign balance | percentage points | 1,2 | 1,9 | 2,5 | 1,7 | -1,0 | 0,5 | 1,5 | 1,0 |
| Consumption of households | real growth in % | -0,9 | -0,5 | -0,1 | -0,6 | -0,9 | 0,0 | 1,6 | -0,5 |
| Consumption of government | real growth in % | -1,8 | -1,2 | -0,5 | -1,2 | -2,5 | -0,3 | 1,1 | -0,5 |
| Fixed capital formation | real growth in % | 1,3 | 2,2 | 3,6 | 2,1 | -2,3 | 0,8 | 3,6 | 1,4 |
| GDP deflator | growth in % | -0,4 | 0,1 | 0,8 | 0,0 | 0,8 | 1,7 | 3,0 | 1,7 |
| Inflation rate (aop) | in % | 1,7 | 1,9 | 2,4 | 1,9 | 2,0 | 2,9 | 3,4 | 3,2 |
| Employment | growth in % | 0,2 | 0,4 | 0,5 | 0,4 | -0,5 | -0,1 | 0,3 | -0,2 |
| Unemployment rate (LFS) | in % | 6,7 | 6,8 | 7,1 | 6,9 | 6,5 | 7,0 | 7,6 | 6,9 |
| Wage bill (domestic concept) | nom. growth in % | 2,0 | 2,5 | 2,9 | 2,3 | 1,8 | 2,7 | 3,8 | 2,7 |
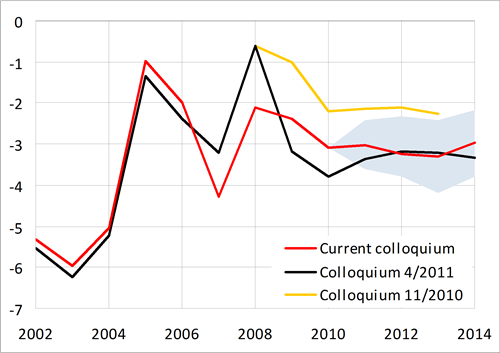
| BoP – current account | in % of GDP | -3,6 | -3,0 | -2,4 | -3,1 | -3,8 | -3,2 | -2,3 | -3,3 |
| 2013 | 2014 | ||||||||
|---|---|---|---|---|---|---|---|---|---|
| min. | average | max. | MoF CR | min. | average | max. | MoF CR | ||
| Assumptions | |||||||||
| GDP of EA12 | real growth in % | 0,1 | 1,2 | 1,6 | 1,6 | 0,5 | 1,5 | 2,2 | 2,0 |
| Crude oil Brent | USD/barrel | 99 | 108 | 115 | 111 | 100 | 111 | 120 | 115 |
| 3M PRIBOR | average in % | 1,1 | 1,6 | 2,0 | 1,7 | 1,3 | 2,2 | 3,0 | 2,6 |
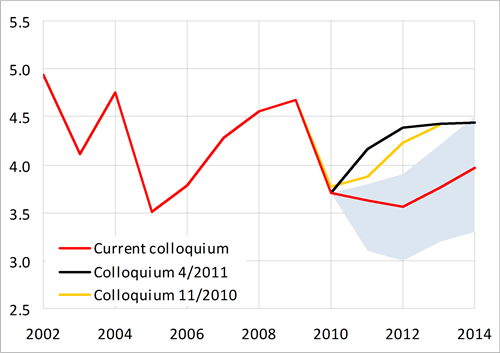
| YTM of 10Y gov. bonds | average in % | 3,2 | 3,8 | 4,2 | 3,9 | 3,3 | 4,0 | 4,5 | 4,2 |
| CZK/EUR exchange rate | 22,5 | 23,6 | 24,3 | 23,4 | 22,0 | 23,4 | 24,0 | 22,9 | |
| USD/EUR exchange rate | 1,25 | 1,33 | 1,37 | 1,35 | 1,30 | 1,33 | 1,35 | 1,35 | |
| Main indicators | |||||||||
| Gross domestic product | real growth in % | 1,1 | 2,1 | 3,6 | 2,0 | 0,8 | 2,3 | 3,5 | 3,3 |
| Contr. of change in inventories | percentage points | -0,8 | -0,1 | 0,2 | 0,0 | -4,5 | -0,8 | 0,2 | 0,0 |
| Contr. of foreign balance | percentage points | 0,2 | 0,6 | 1,0 | 0,8 | -0,7 | 0,5 | 1,4 | 1,2 |
| Consumption of households | real growth in % | 0,5 | 1,7 | 2,6 | 1,2 | 1,0 | 2,2 | 3,0 | 2,5 |
| Consumption of government | real growth in % | -1,0 | 0,6 | 2,0 | -0,2 | 0,0 | 0,8 | 2,5 | 0,8 |
| Fixed capital formation | real growth in % | 0,0 | 2,7 | 4,8 | 2,8 | 1,5 | 2,9 | 5,0 | 3,2 |
| GDP deflator | growth in % | 0,9 | 1,6 | 2,6 | 0,9 | 1,3 | 1,7 | 2,3 | 1,3 |
| Inflation rate (aop) | in % | 1,3 | 1,9 | 2,6 | 1,6 | 1,3 | 2,0 | 2,4 | 2,1 |
| Employment | growth in % | -0,7 | 0,0 | 0,6 | 0,1 | -0,2 | 0,3 | 0,8 | 0,5 |
| Unemployment rate (LFS) | in % | 6,3 | 6,8 | 7,7 | 6,9 | 5,5 | 6,5 | 7,2 | 6,7 |
| Wage bill (domestic concept) | nom. growth in % | 2,9 | 3,7 | 4,5 | 2,9 | 3,1 | 3,9 | 4,7 | 4,7 |
| BoP – current account | in % of GDP | -4,2 | -3,3 | -2,4 | -3,8 | -3,8 | -3,0 | -2,2 | -3,8 |
The main trends in macroeconomic development can be summed up as follows:
-
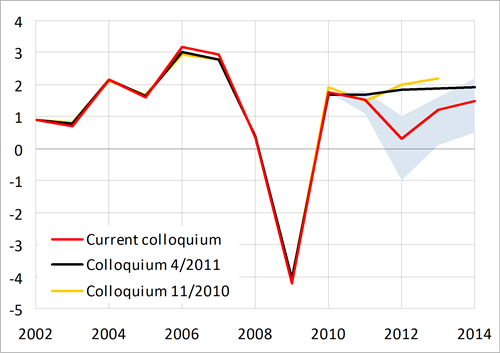
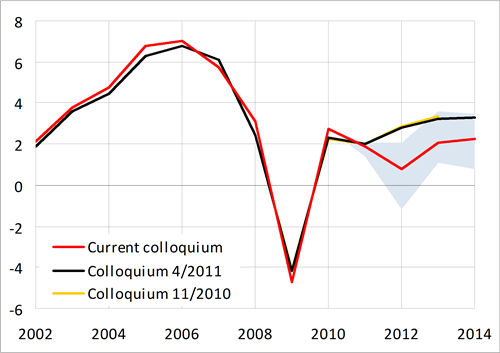
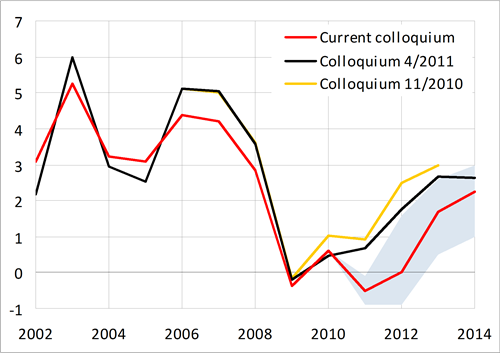
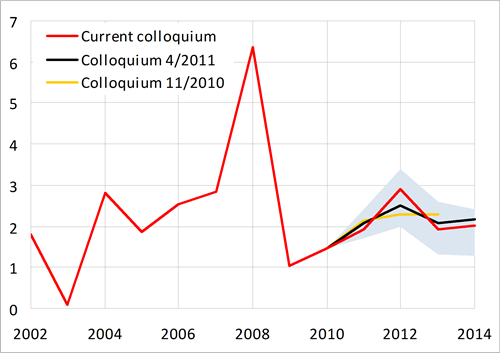
On average, the institutions expect GDP to grow by 1.9 % this year. A slowdown is expected for 2012, but growth should remain positive and GDP could increase by 0.8 %. In 2013 and 2014, economic growth should marginally exceed 2 %. The MoF forecast is in line with prognoses of other institutions, though it is more optimistic for 2014.
-
With the exception of 2012, inflation rate should stay close to the CNB's inflation target in the whole forecasting horizon. The one-off increase in inflation in 2012 is explained mostly by the expected impact of VAT changes. The MoF forecast differs from other institutions' forecasts only marginally.
-
A modest growth of employment, which is on average envisaged by the institutions for this year, should be followed by stagnation in 2012 and 2013. Employment should grow again only in 2014. The MoF forecast is in line with prognoses of other institutions.
-
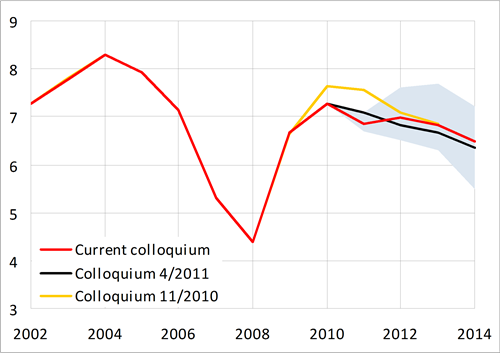
On average, forecasts of the participating institutions see a minor increase in unemployment rate in 2012 and a moderate decline in the following years. The MoF expects unemployment rate to stagnate closely below 7 % during 2011-2013 and decrease only in 2014. However, the deviation from the average of other forecasts is negligible.
-
According to the current forecasts, growth of the total wage bill should accelerate from 2.5 % in 2011 to 3.9 % in 2014. The MoF forecast is in line with this tendency, though the wage bill growth is expected to be lower in 2013 and higher in 2014.
The next Colloquium will take place in April 2012.
Overview of indicators
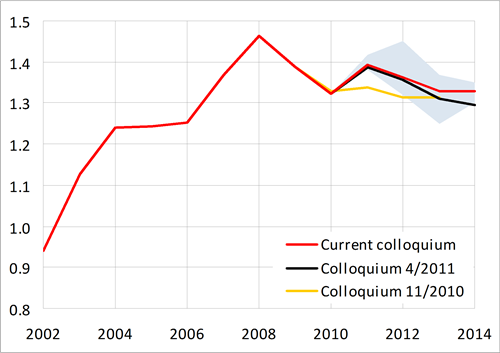
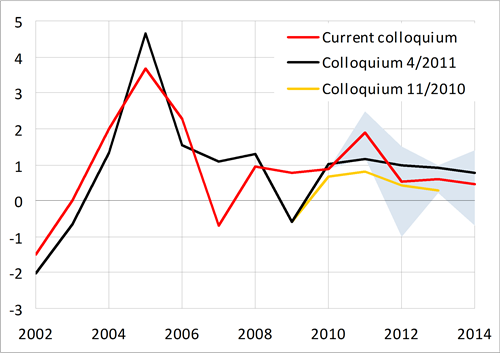
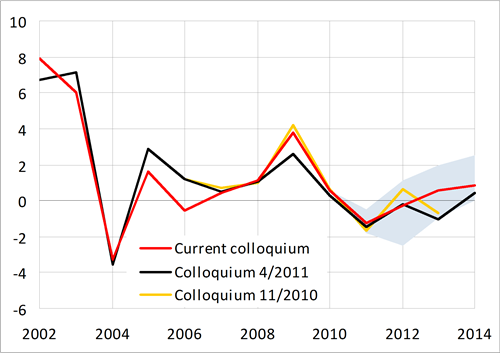
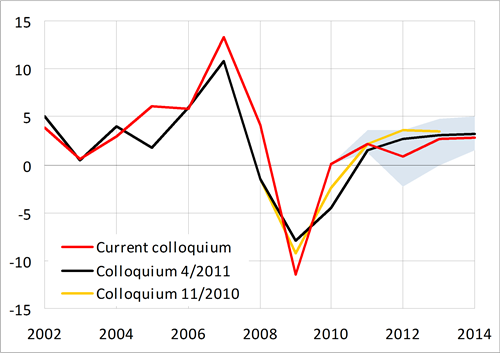
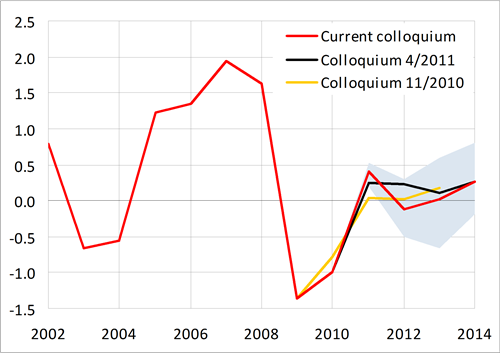
The depiction of past and expected developments of individual indicators is shown in graphs 1-18. For the sake of comparison, consensus forecasts of two previous Colloquiums are also included. Extreme forecasts of indicators (min. and max. columns in the tables) form the boundaries of the highlighted area. The revised yearly national accounts data has been used.
Graph 1: Gross domestic product of EA12
Graph 2: Crude oil Brent
Graph 3: 3M PRIBOR
Graph 4: YTM of 10Y government bonds
Graph 5: CZK/EUR exchange rate
Graph 6: USD/EUR exchange rate
Graph 7: Gross domestic product
Graph 8: Contribution of change in inventories
Graph 9: Contribution of foreign balance
Graph 10: Consumption of households
Graph 11: Consumption of government
Graph 12: Gross fixed capital formation
Graph 13: GDP deflator
Graph 14: Inflation rate (aop)
Graph 15: Employment (LFS)
Graph 16: Unemployment rate (LFS)
Graph 17: Total wage bill (domestic concept)
Graph 18: Balance of payments - current account
Graph 1: Gross domestic product of EA12
real growth in %
Graph 2: Crude oil Brent
USD/barrel
.png)
Graph 3: 3M PRIBOR
average in %
.png)
Graph 4: YTM of 10Y government bonds
average in %
Graph 5: CZK/EUR exchange rateGraph
Graph 6: USD/EUR exchange rate
Graph 7: Gross domestic product
real growth in %
Graph 8: Contribution of change in inventories
percentage points
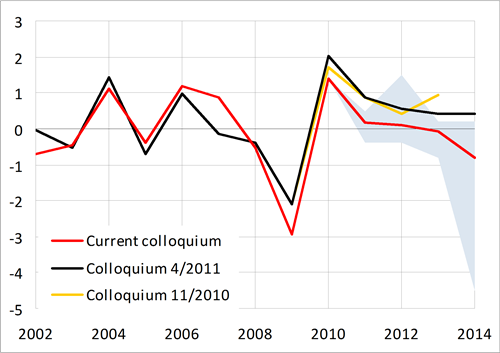
Graph 9: Contribution of foreign balance
percentage points
Graph 10: Consumption of households
real growth in %
Graph 11: Consumption of government
real growth in %
Graph 12: Gross fixed capital formation
real growth in %
Graph 13: GDP deflator
growth in %
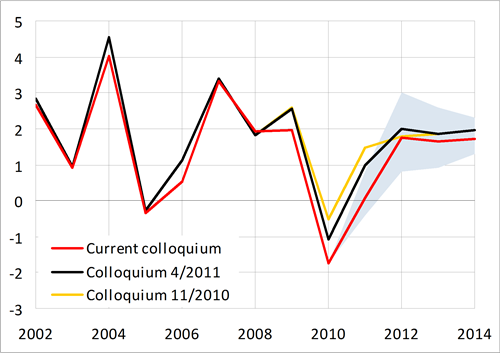
Graph 14: Inflation rate (aop)
in %
Graph 15: Employment (LFS)
growth in %
Graph 16: Unemployment rate (LFS)
in %
Graph 17: Total wage bill (domestic concept)
nominal growth in %
.png)
Graph 18: Balance of payments - current account
in % of GDP